🎵 Spotify Data Observatory 🎵
An interactive gallery exploring a century of music data
📈 Music Evolution
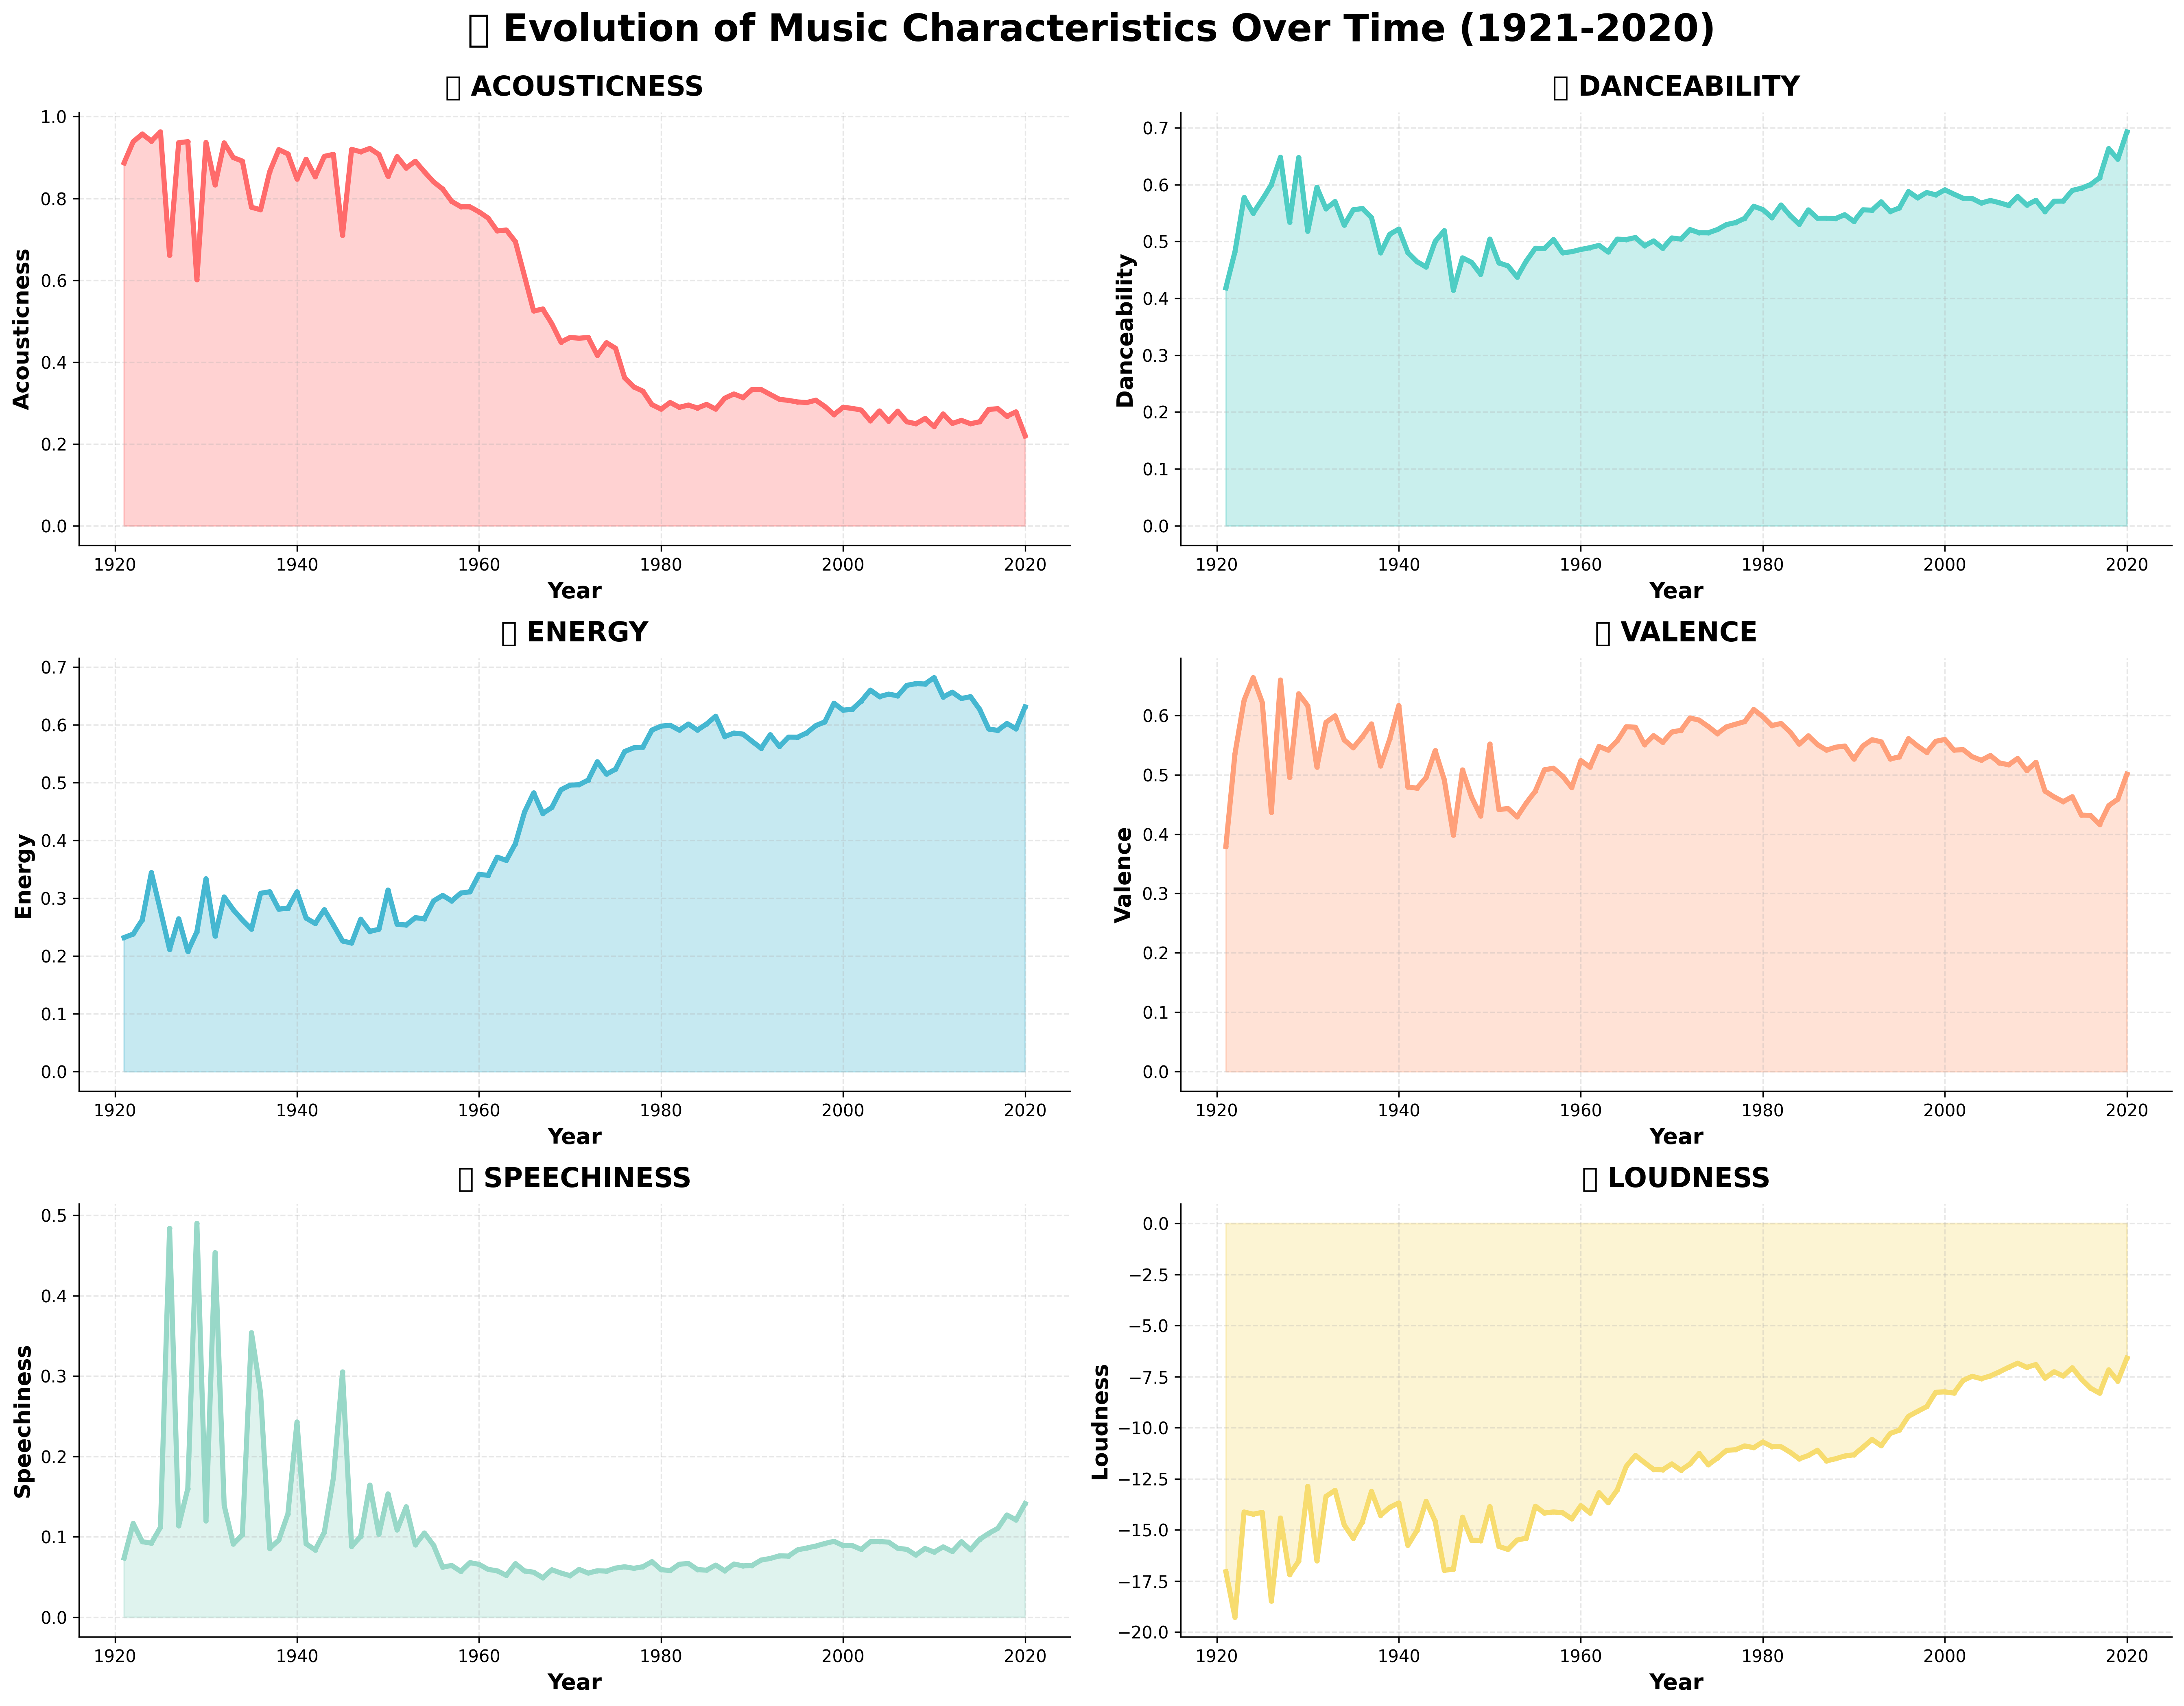
Evolution Over Time
How 6 key music characteristics evolved from 1921 to 2020.
Interactive Evolution
Explore music trends interactively with hover details and zoom capabilities.
View Interactive →🎬 Animated Timeline
Watch music evolution unfold year by year with play/pause controls.
Watch Animation →🔥 Correlation Analysis
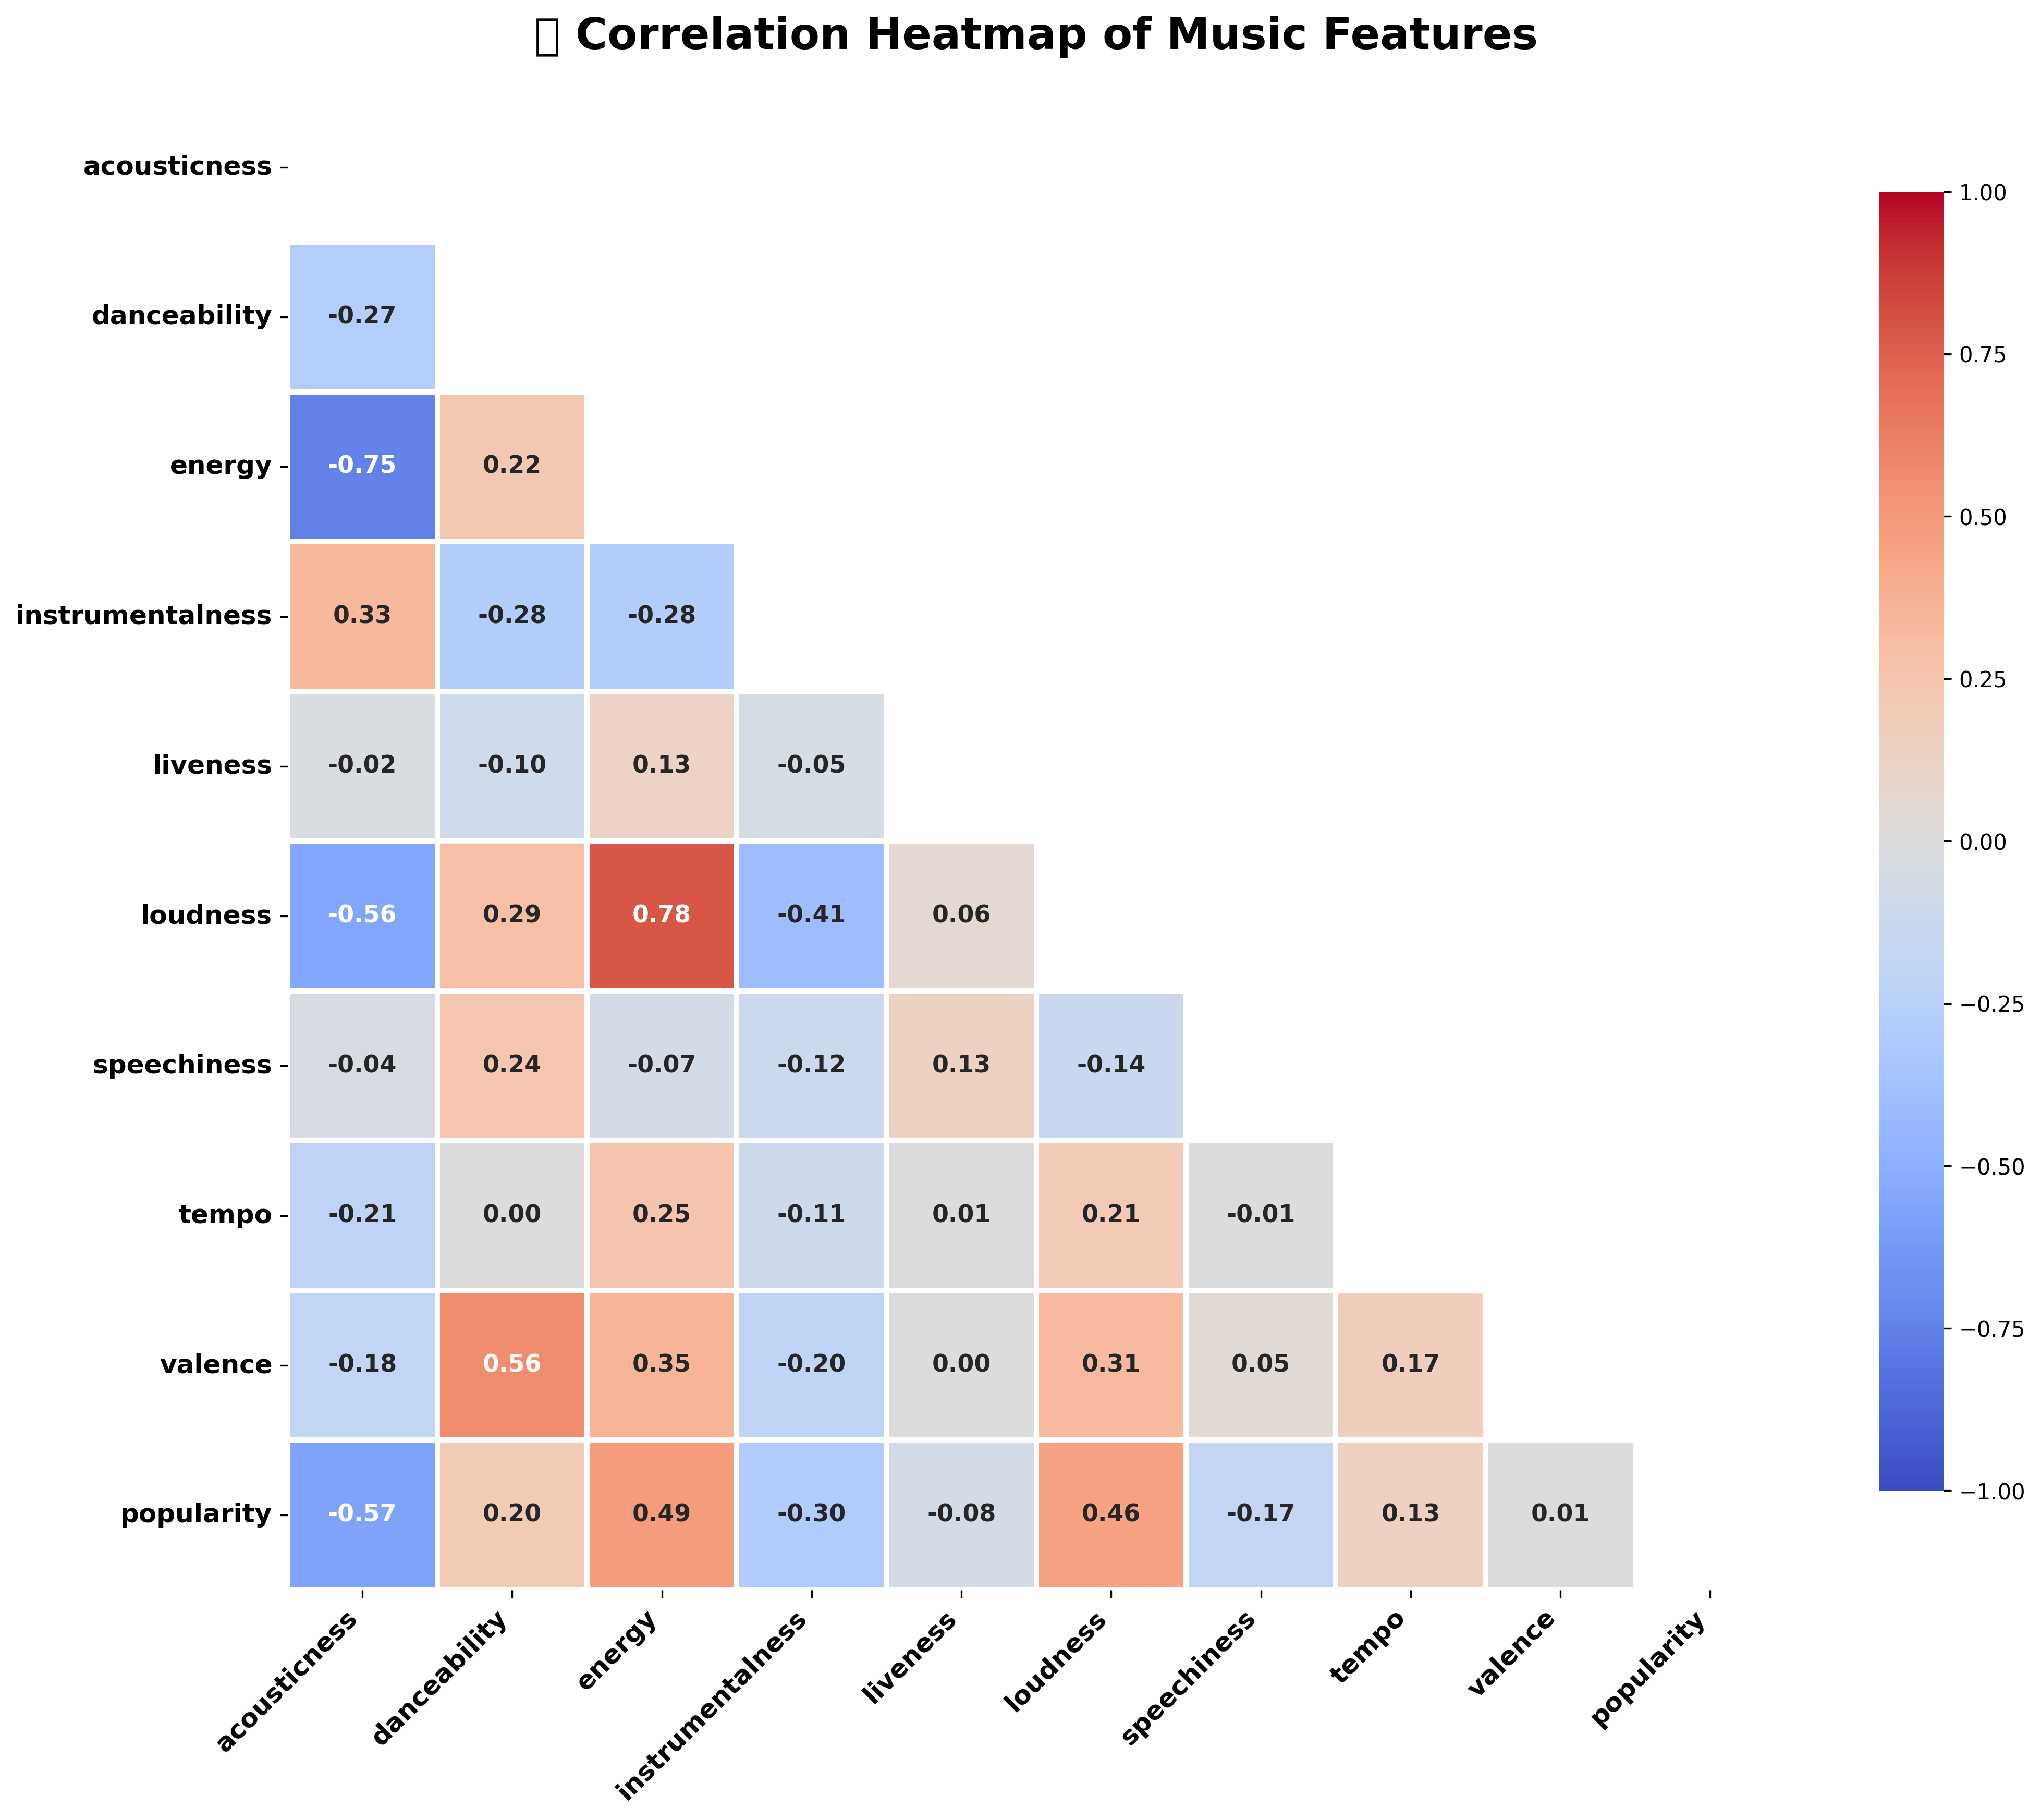
Correlation Heatmap
Discover relationships between musical features at a glance.
Interactive Matrix
Explore correlations interactively with detailed hover information.
Explore Matrix →Top Correlations
Discover the strongest relationships between music features.
View Chart →🎸 Genre Analysis
Top 25 Genres
Most popular genres ranked by average popularity score.
View Rankings →🌐 Genre Radar Profiles
Radar chart comparison of top 5 genre characteristics.
Compare →Multi-Feature Dashboard
Comprehensive comparison across multiple musical dimensions.
Explore Dashboard →💫 Genre Universe
Bubble chart visualization of genre characteristics.
Visualize →🎤 Artist Analysis
Top 20 Artists
Most popular artists by average track popularity.
View Rankings →Artist Feature Scatter
Scatter plot of energy vs danceability for top 50 artists.
Explore Scatter →Artist Radar Profiles
Radar chart comparison of top 10 artist musical profiles.
Compare Profiles →Artist Feature Heatmap
Comprehensive feature analysis for top 15 artists.
View Heatmap →💃 Scatter & 3D Visualizations
Danceability vs Energy
5000 tracks colored by mood (valence), sized by popularity.
Explore →Acousticness vs Energy
See how the acoustic-to-energy balance shifts over the decades.
View Evolution →🌀 3D Music Space
Interactive 3D plot of acousticness, energy & danceability.
Explore 3D →🎞️ Animated Bubble Timeline
Watch music evolution through decades with an animated bubble chart.
Watch Animation →Valence vs Tempo
Understand how tempo and mood interplay across tracks.
View Chart →📊 Distribution Analysis
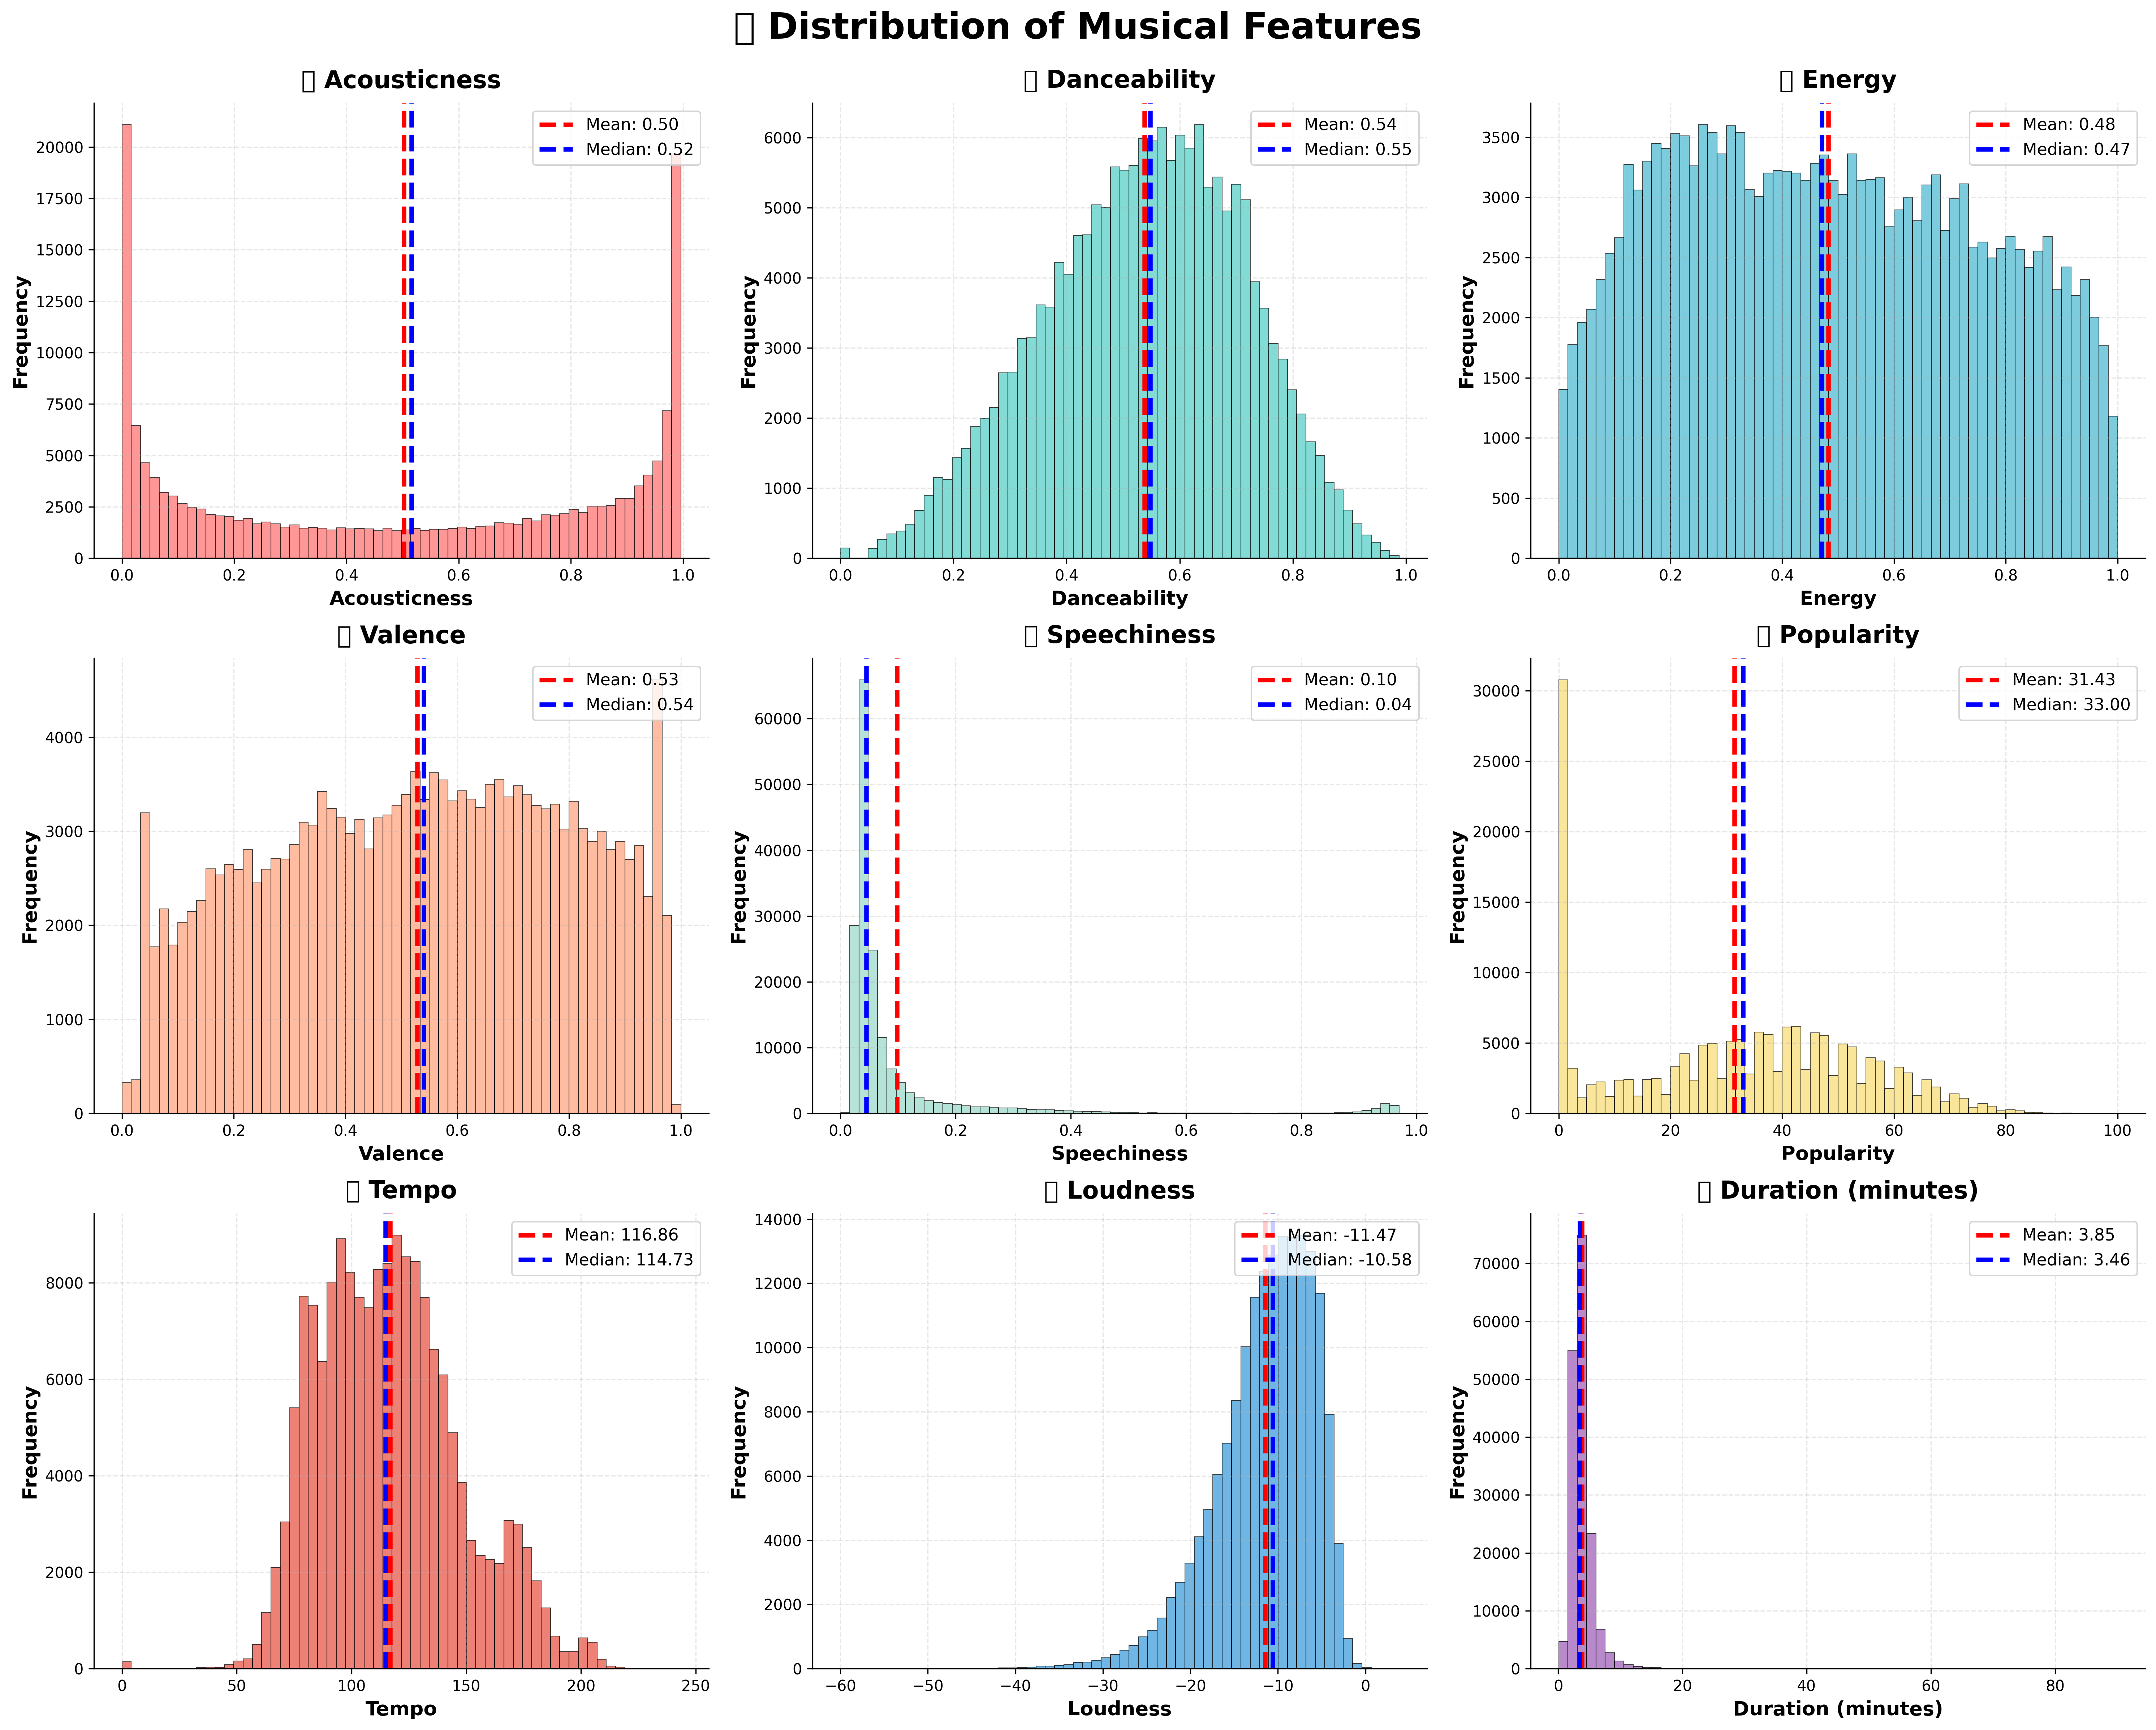
Feature Distributions
Statistical distributions of 9 key audio features.
🎻 Interactive Violin Plots
Compare feature distributions with violin plots and summary stats.
Explore Plots →Box Plots by Decade
How energy, danceability, valence, and popularity spread over time.
View Decades →Tempo Distribution
Detailed analysis of tempo (BPM) distribution with a KDE overlay.
Explore Tempo →🎹 Keys & Modes
Breakdown of musical keys alongside the major/minor split.
View Analysis →⏱️ Temporal Analysis
Song Duration Trends
How the average song length has changed through the decades.
View Trends →Popularity Trends
The evolution of average popularity scores from year to year.
Explore Popularity →Explicit Content Trends
The rise of explicit tracks as a percentage of content over time.
View Chart →🧭 Trends Dashboard
Unified dashboard for energy, danceability, valence, and popularity.
View Dashboard →Tempo Evolution
Tempo trends with moving averages and confidence bands.
Explore Evolution →📂 Reports
Summary Report
Average Music Characteristics
- Danceability 0.5374 (σ=0.1761)
- Energy 0.4824 (σ=0.2676)
- Acousticness 0.5021 (σ=0.3760)
- Valence (Mood) 0.5286 (σ=0.2632)
- Loudness -11.47 dB (σ=5.70)
- Tempo 116.9 BPM (σ=30.7)
Top Artists by Popularity
- 1. Ritt Momney 93.00
- 2. Lele Pons 92.00
- 3. Los Legendarios 90.00
- 4. Jerry Di 89.00
- 5. Emilee 88.00
Key Insights
- Music has become significantly less acoustic over the century.
- Energy levels have increased, indicating more energetic modern music.
- 70.7% of tracks are in major keys, suggesting an overall positive mood.
Musical Key Analysis
- C 12.66%
- G 12.19%
- D 11.03%
- A 10.3%
- F 9.63%
- E 7.58%
- C# 7.55%
- A# 7.12%
- G# 6.3%
- B 6.25%
- F# 5.12%
- D# 4.28%
Temporal Trends
- Acousticness 0.887 (1921) → 0.220 (2020)
- Energy 0.232 (1921) → 0.631 (2020)
- Danceability 0.419 (1921) → 0.693 (2020)
Summary Statistics
Loading statistics...